Here you will see a simple overview of how your business is performing online:
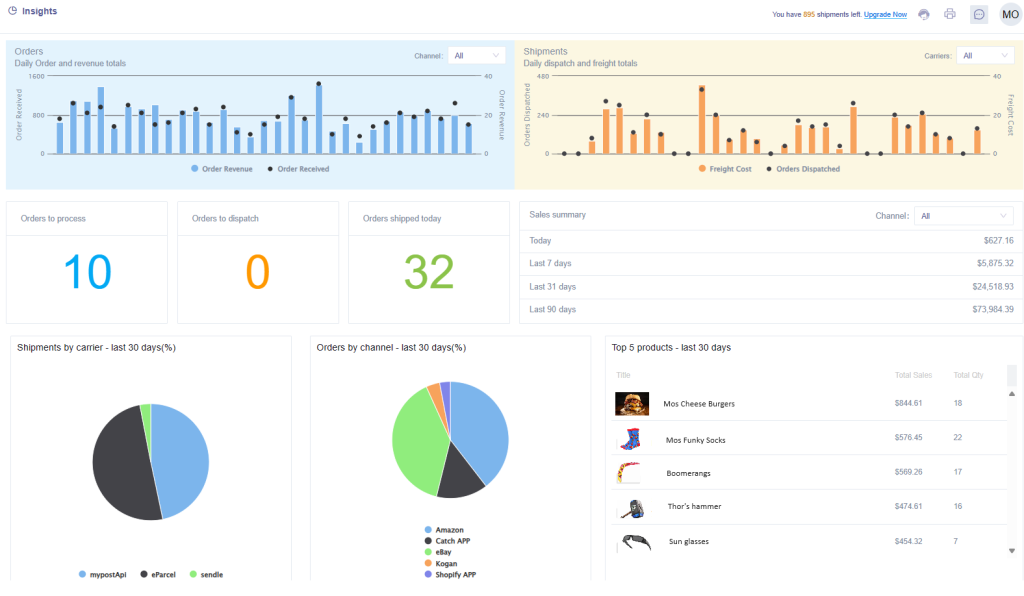
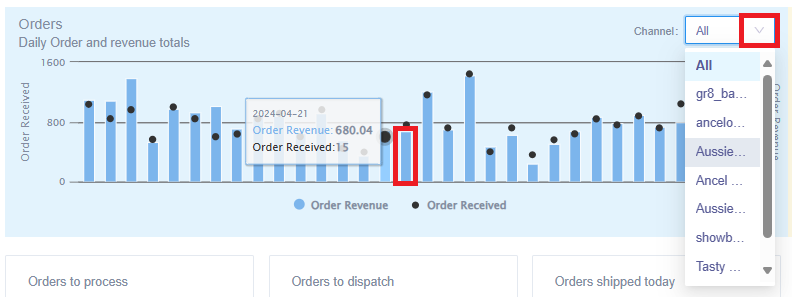
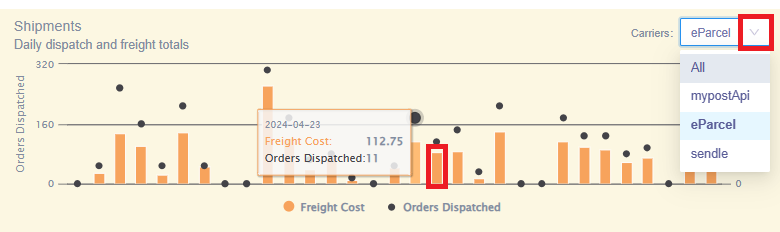
The interactive Orders and Shipments bar graphs will allow you to hover your mouse over the bars to view more detailed information. The dropdowns will allow you to select other sales channels and carriers so you can view their information individually:
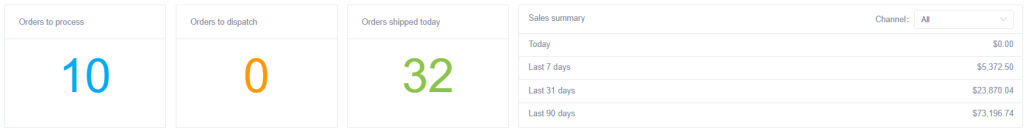
The middle section will give you a live summary of your orders to process, dispatch and were shipped for the current day. A sales summary is also provided for the current day, last 7, 31 and 90 days:
Hover your mouse over the interactive pie charts to view a percentage of consignments processed per carrier, and a percentage of consignments created per sales channel:

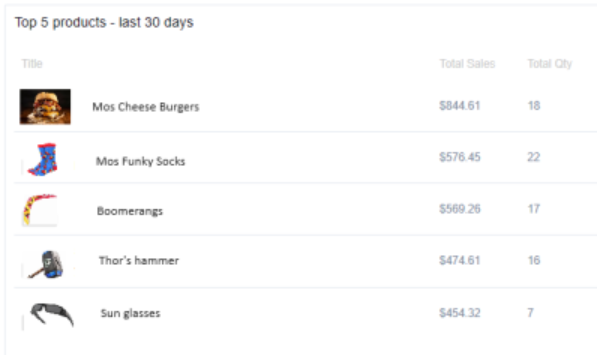
Lastly a summary of your top 5 selling products in the last 30 days: