Here you will see a simple overview of how your business is performing online:
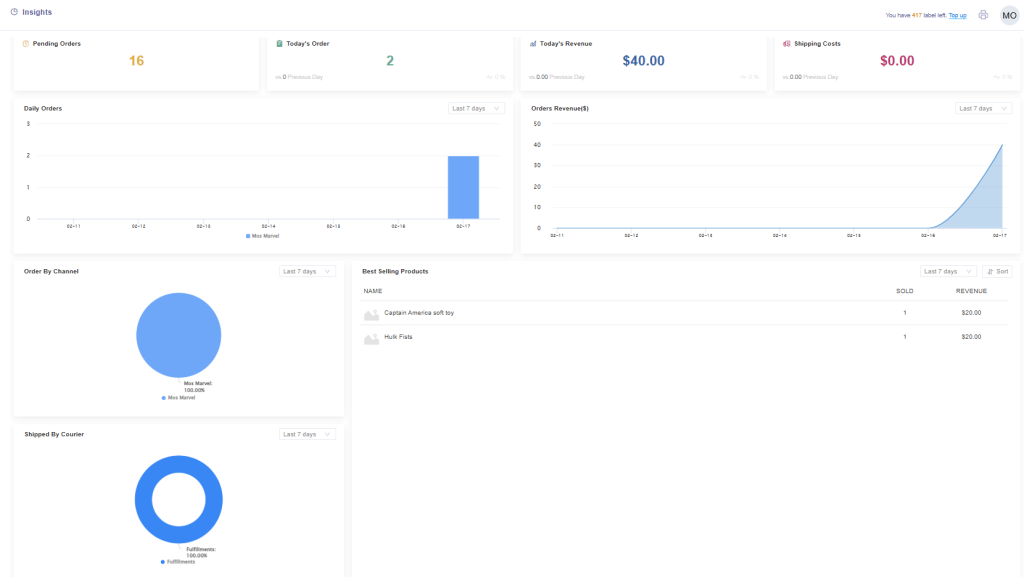
These sections display the following information:
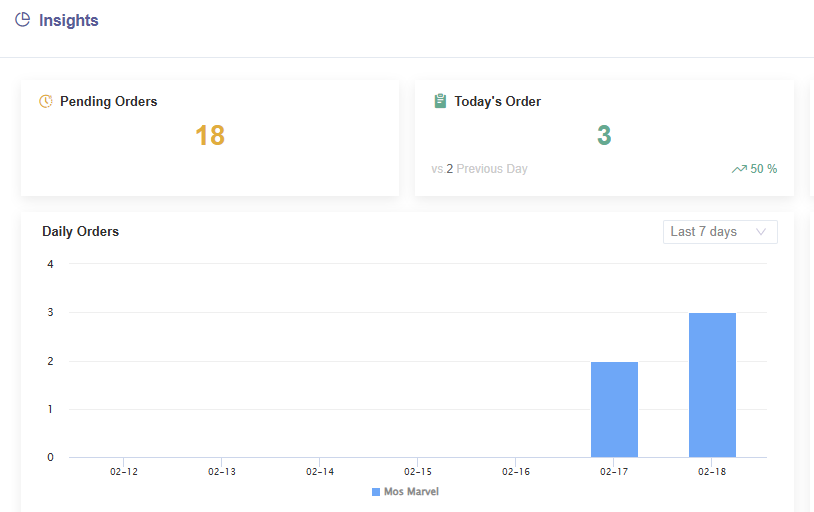
*Pending Orders – Orders that are waiting to be fulfilled in ShipMarvel Pro
*Today’s Order – Orders synced into ShipMarvel Pro today
*vs (?) Previous Day – Number of orders from the previous day.
*Percentage – Displays an increase or decrease by percentage comparing today from previous day.
*Daily Orders – Orders shown by day in a bar graph and can be sorted using the drop-down options to show more days.
These sections display the following information:
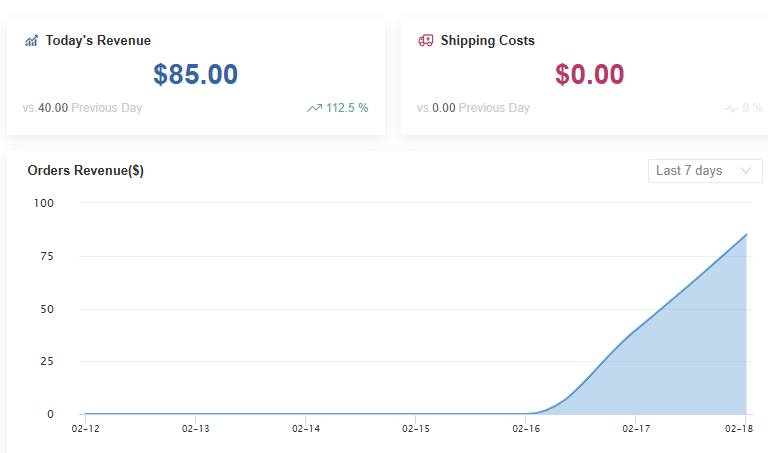
*Today’s Revenue – The total revenue from today’s orders
*vs (?) Previous Day – Yesterday’s total revenue
*Percentage – Displays an increase or decrease by percentage comparing today from previous day.
*Shipping Costs – Today’s total spend on shipping.
*vs (?) Previous Day – Yesterday’s shipping cost
*Percentage – Displays an increase or decrease by percentage comparing today from previous day.
*Orders Revenue – This graph shows the daily revenue. Use the drop-down options to view more days.
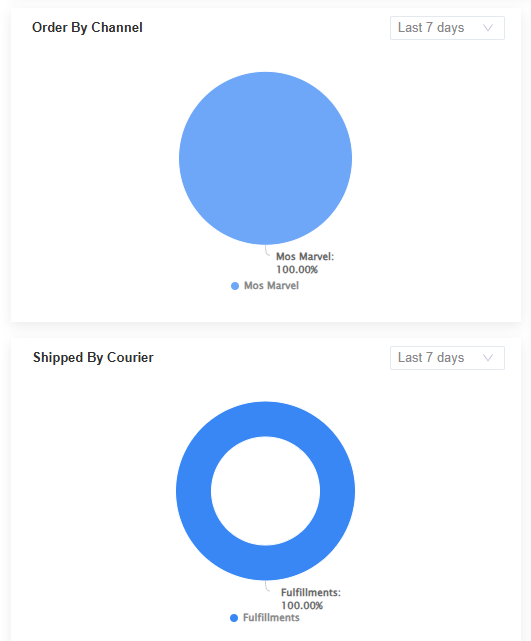
Order By Channel – This graph will show the percentage of orders received by each sales channel.
Shipped By Courier – This graph will show the percentage of shipments assigned to each carrier for delivery.
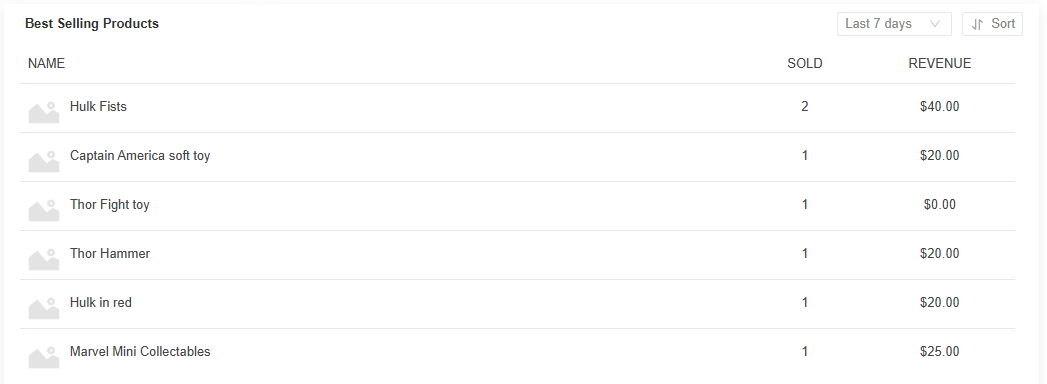
This section will list the best-selling products. Use the drop-down options to view more days or use the Sort function to sort by highest sold products, or highest revenue.